1. Sunlight is free; the system is not
Land, modules, inverter, cable, transformer, finance, grid and maintenance turn sunlight into billable power.
Investor lens: who controls the bottleneck?
First understand the sector: products, economics, storage, grid and business models. Then examine 24 listed companies using one strict, evidence-led 14-pattern framework.
Solar is not one single industry. It is a chain of factories, equipment, projects, contracts and regulated infrastructure—each with different margins, cash cycles and risks.
Read these first. They create the mental model needed for every company scorecard later in the report.
Land, modules, inverter, cable, transformer, finance, grid and maintenance turn sunlight into billable power.
Investor lens: who controls the bottleneck?Cells make electricity; glass, films, frames, junction boxes and connectors protect output for years.
Quality + warranty matter.A completed plant earns nothing when transmission or evacuation is delayed.
No grid connection means no cash from the plant.Batteries move solar power from noon to evening and help make renewable supply predictable.
Energy becomes reliability.Oversupply, working capital, debt and falling prices can destroy returns while volumes rise.
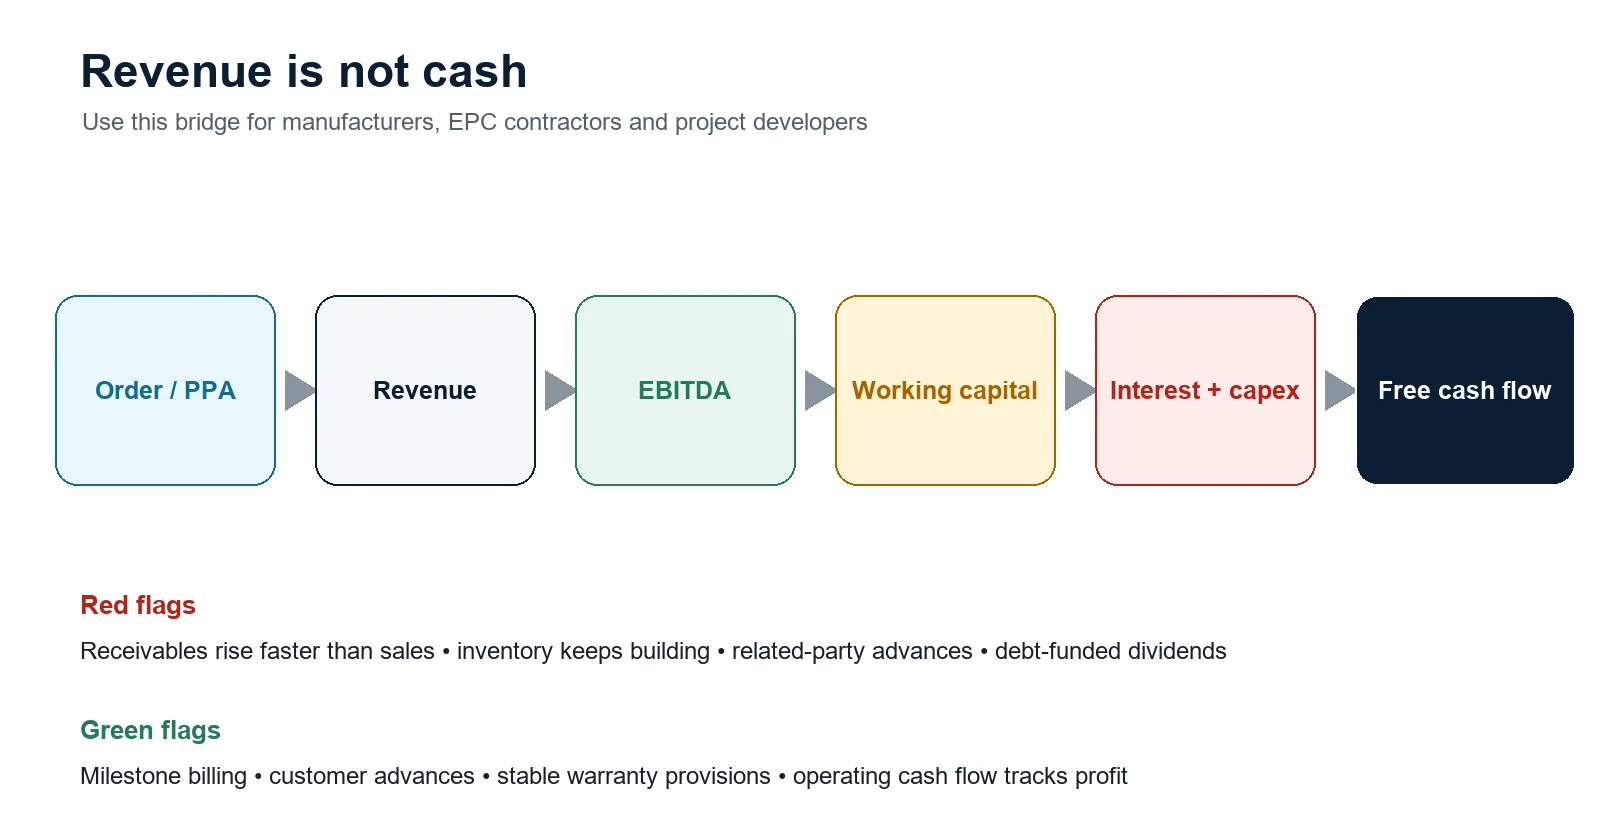
Trace the bridge from revenue to cash.A manufacturer, EPC contractor, utility and rooftop platform should never be valued with one identical rule.
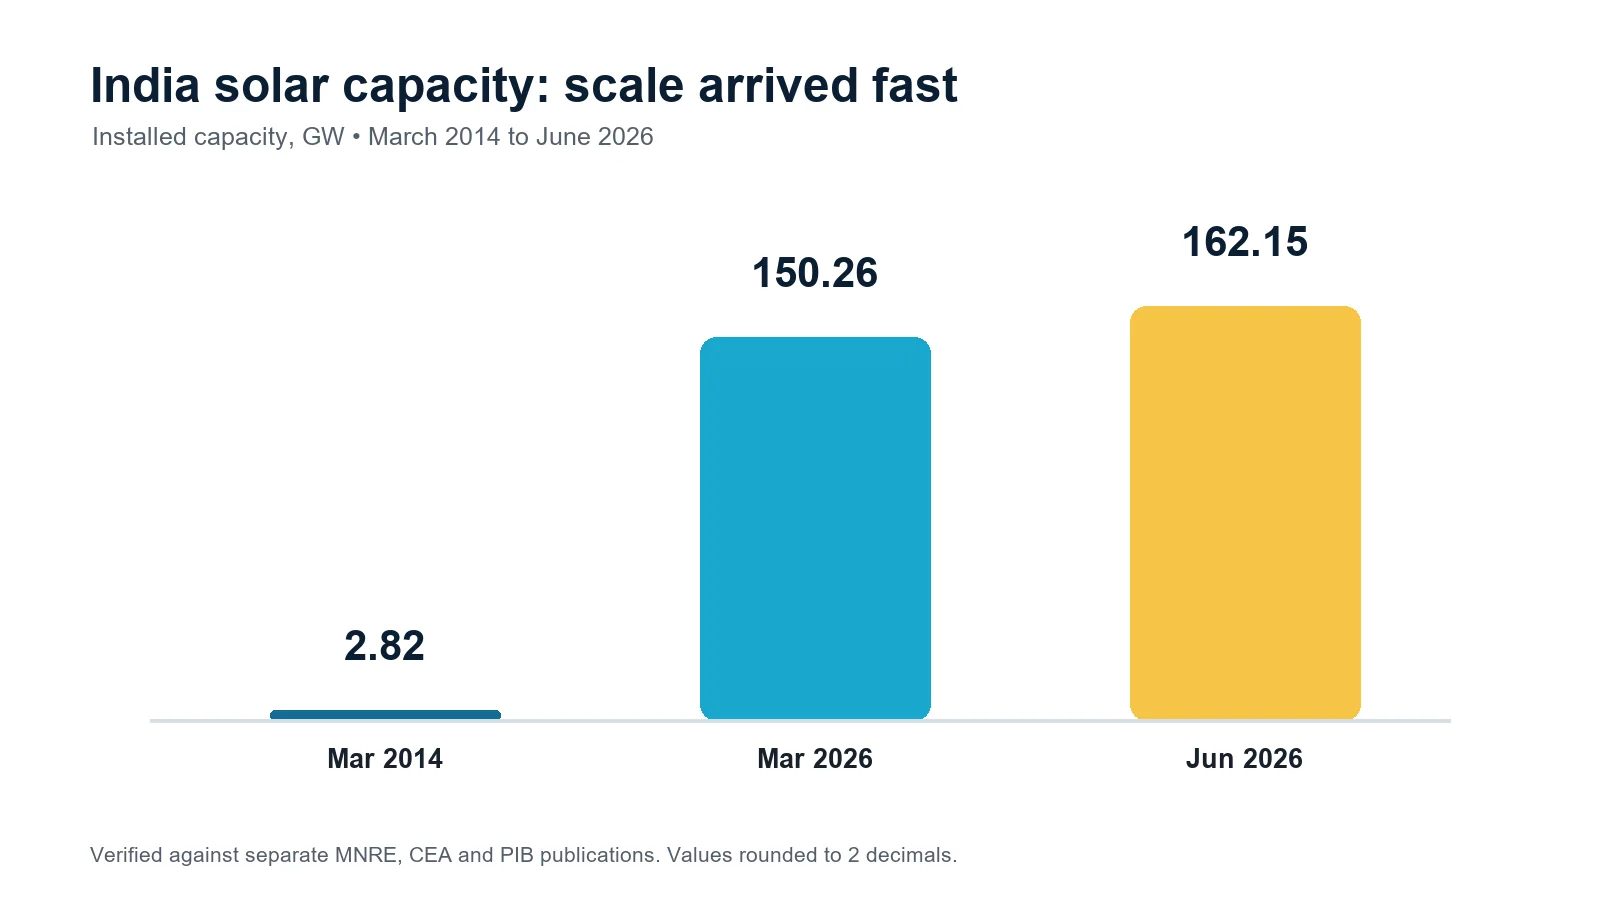
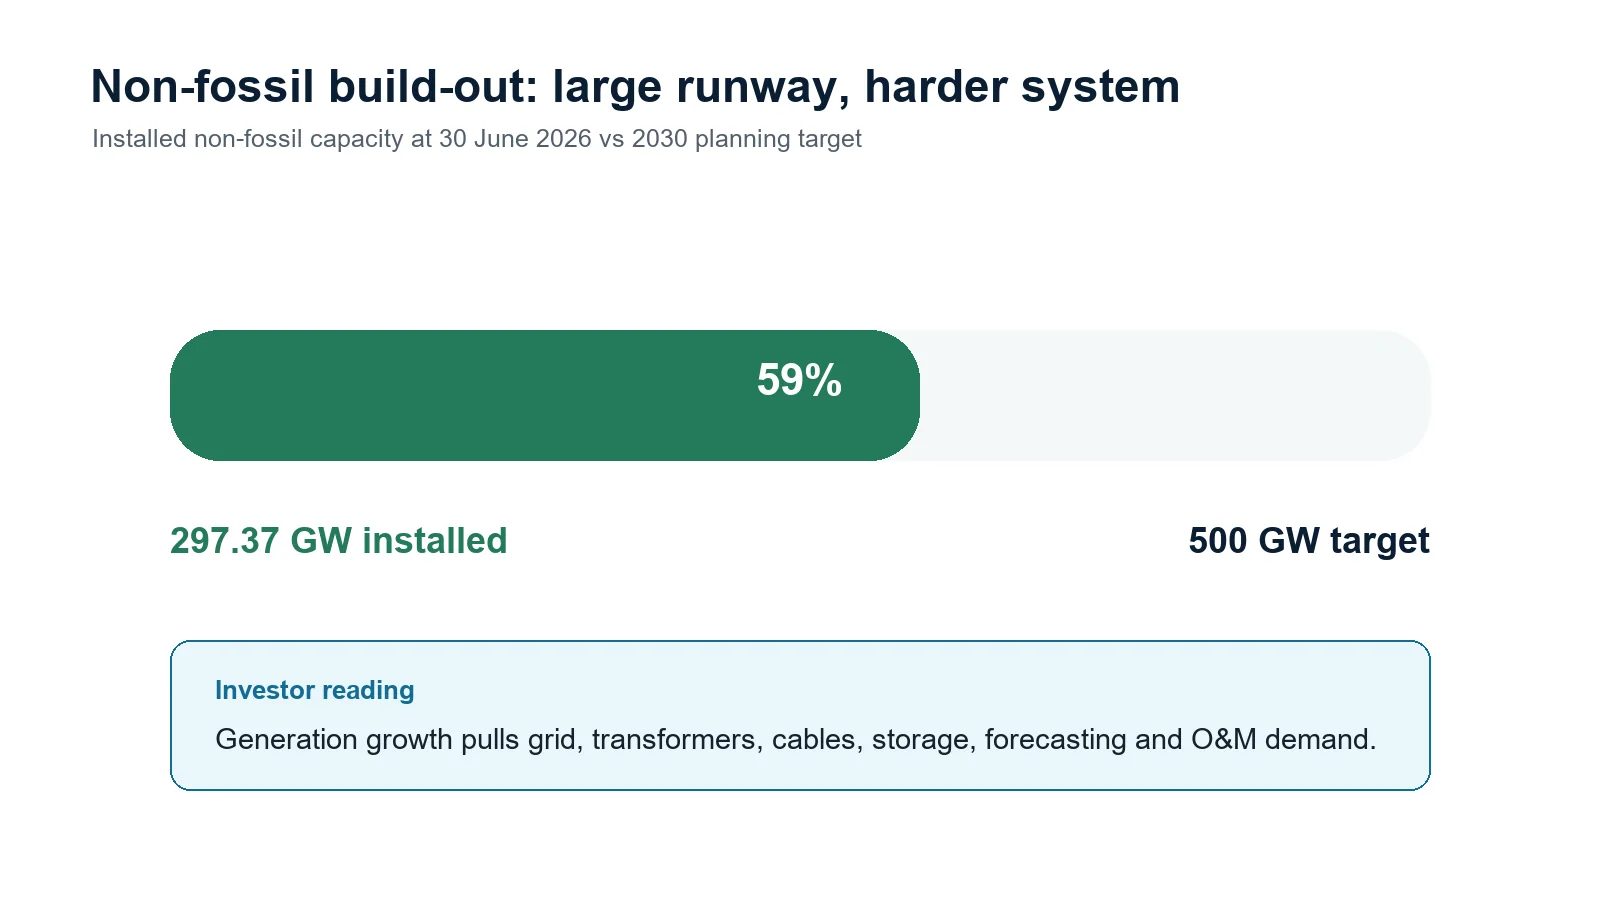
Understand the business model before the valuation multiple.India as at 30 June 2026; reconciled across MNRE, CEA and PIB publications.
CEA underlying 297,369 MW, rounded to two decimals.
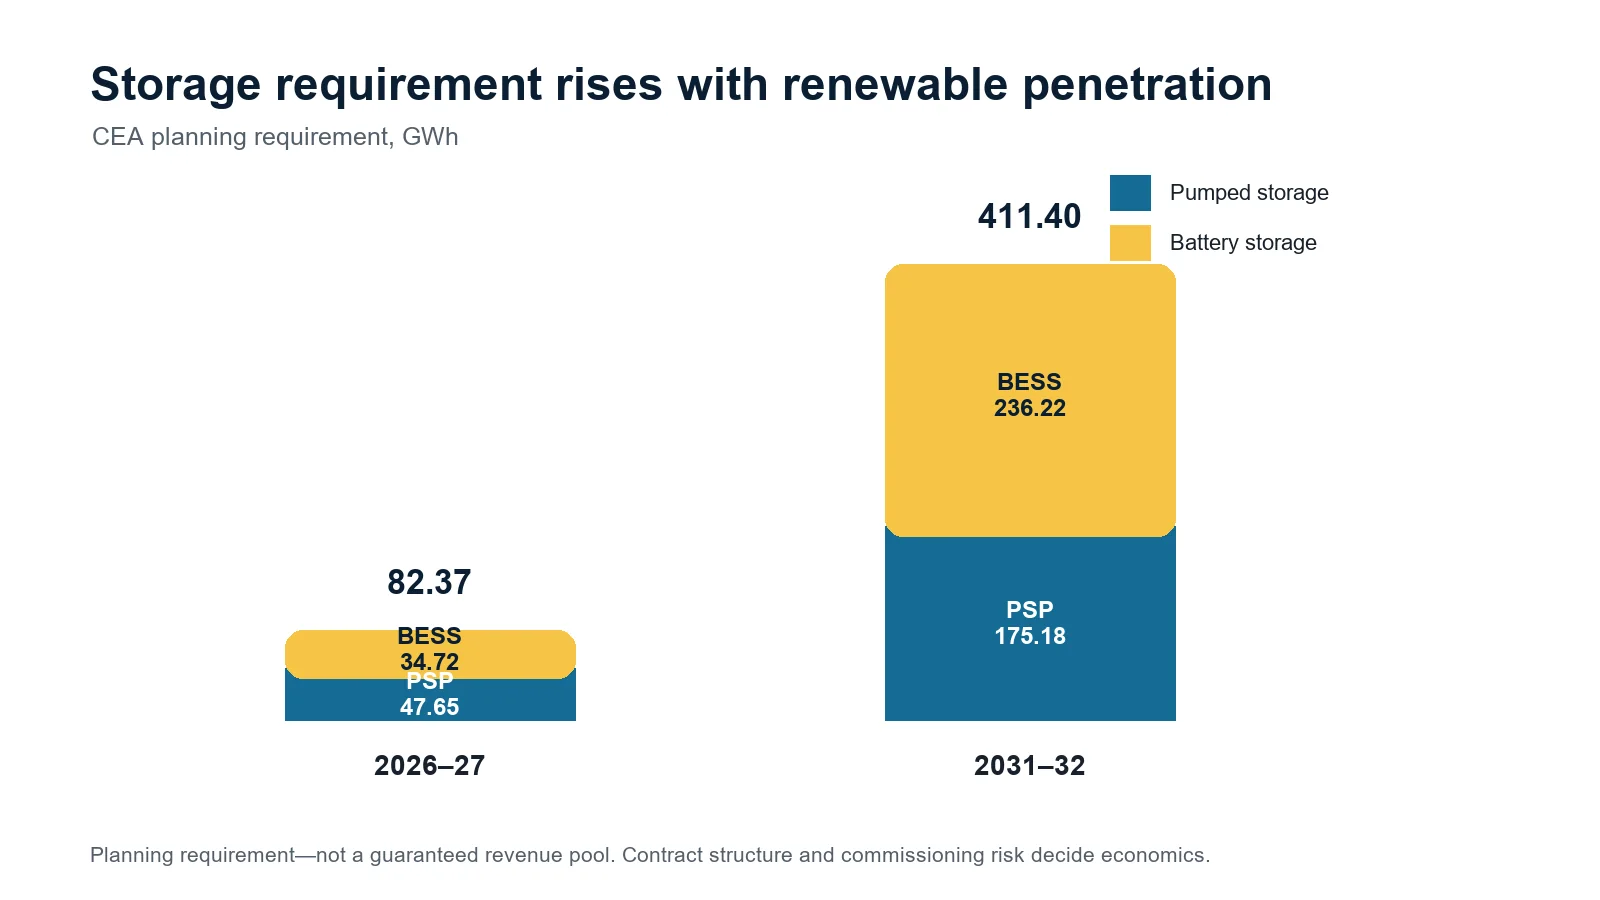
A planning direction—not guaranteed company revenue.
Material sector numbers passed the three-source figure audit.
Firm and dispatchable renewable power: solar + wind + storage + contract.
Grid modernisation: transmission, transformers, cables, power quality and digital control.
Cash conversion: announced capacity and order books are not cash until commissioning and collection.
The same solar boom produces very different economics. Manufacturers fight utilisation and technology cycles; EPC companies fight working capital; generators fight leverage and commissioning; grid suppliers fight project execution.
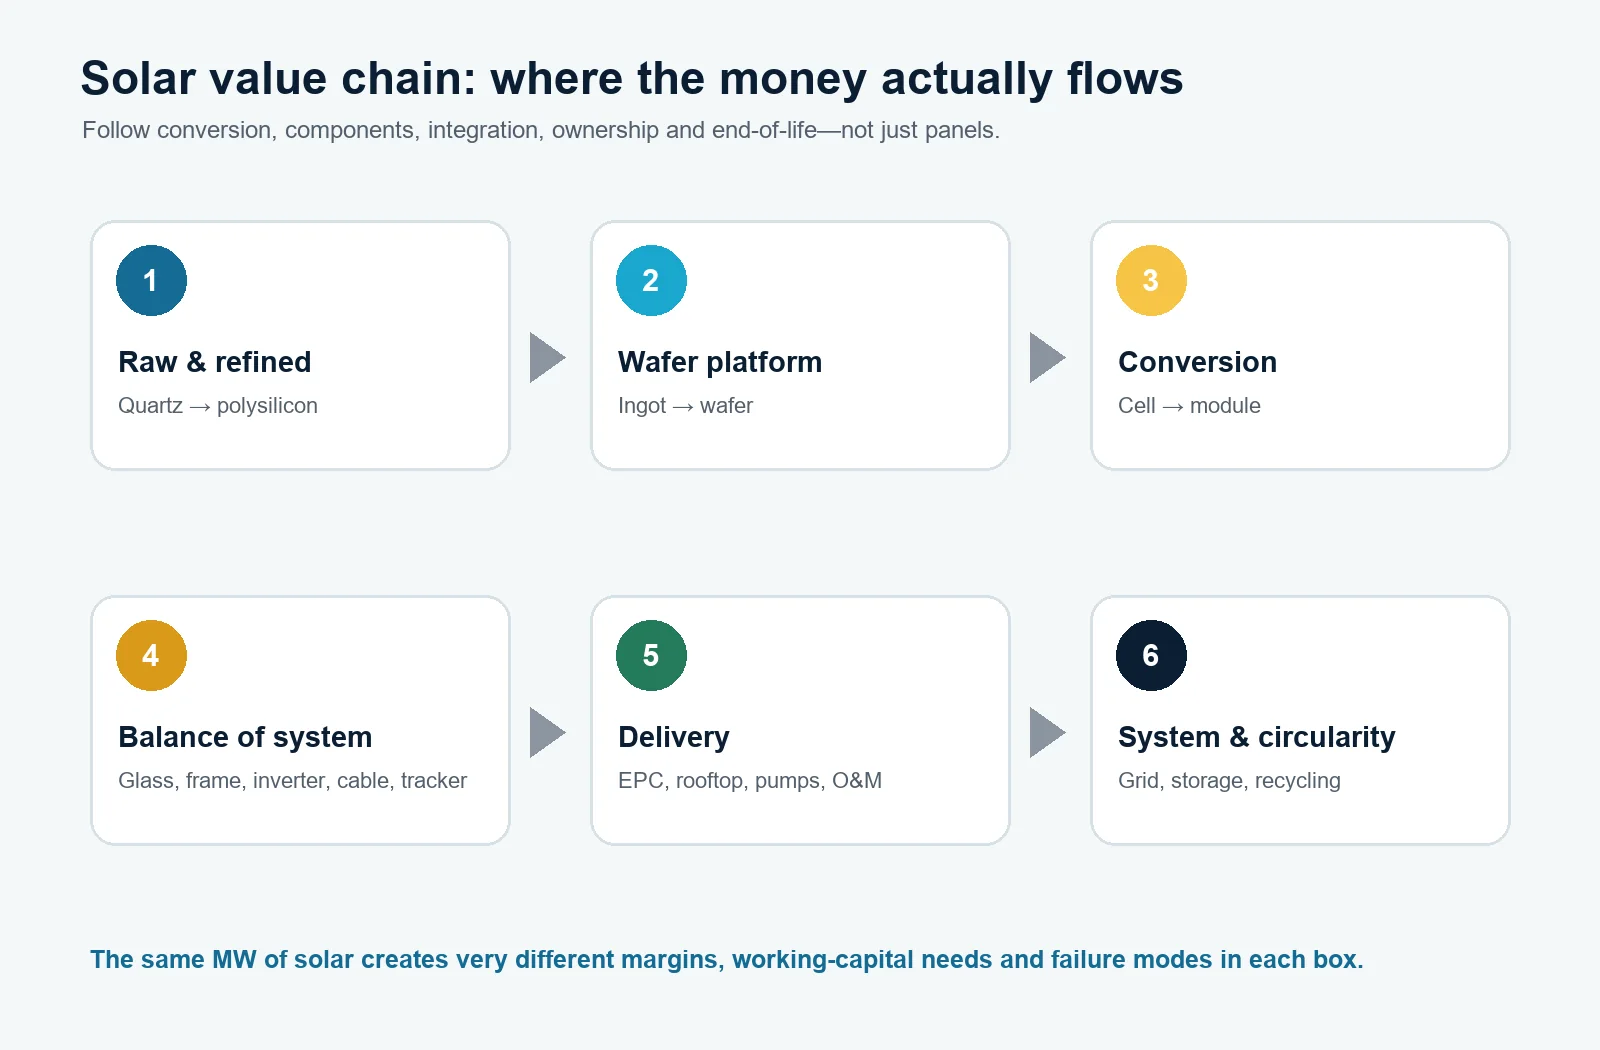
Some integrated companies appear in more than one box; the company universe still contains 24 unique names. Tata Power was present twice in the folders but was scored once.
The useful question is no longer whether solar grows. The question is which business converts that growth into durable cash.
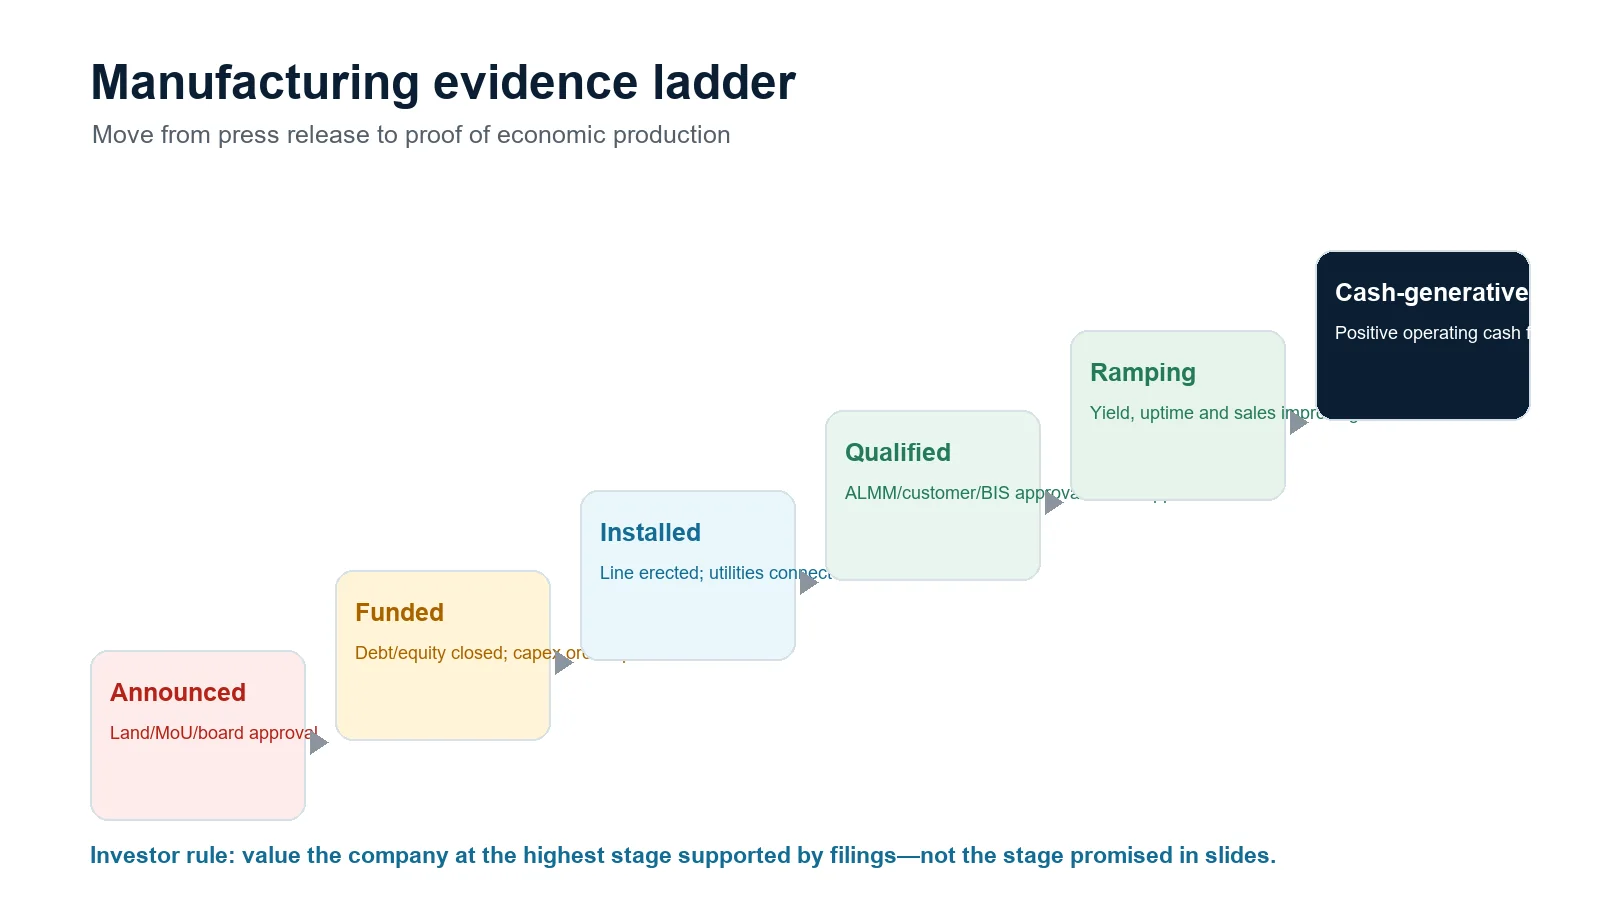
Manufacturing is a precision and utilisation business. “Factory announced” and “cash-generative output” are completely different stages.
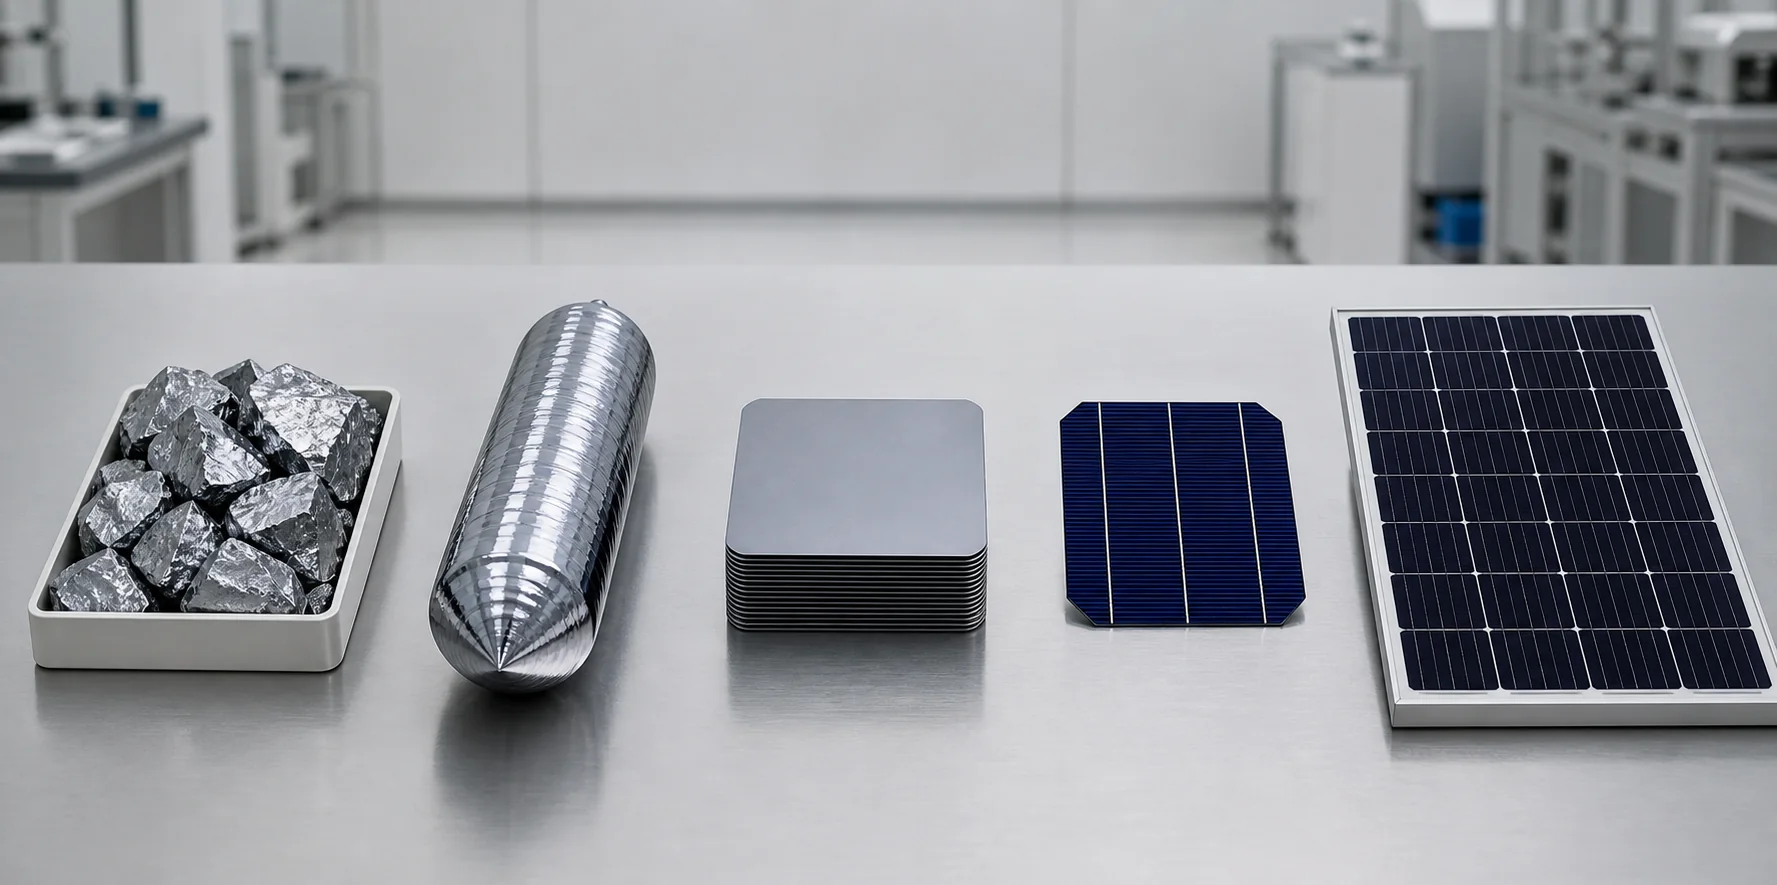
| Product | What it does | Profit driver | Failure mode |
|---|---|---|---|
| Polysilicon | Ultra-pure silicon feedstock | Power cost, purity, scale | Global oversupply and price crash |
| Ingot / wafer | Crystal grown and sliced thin | Yield, thickness, format | Technology and format change |
| Solar cell | Converts light into DC electricity | Efficiency, yield, uptime | Production line becomes outdated |
| Module | Packages cells into a durable product | Bill of materials, brand, channel | Low entry barrier, price fall, warranty |
A low-cost component can create a large lifetime loss if it fails in the field.
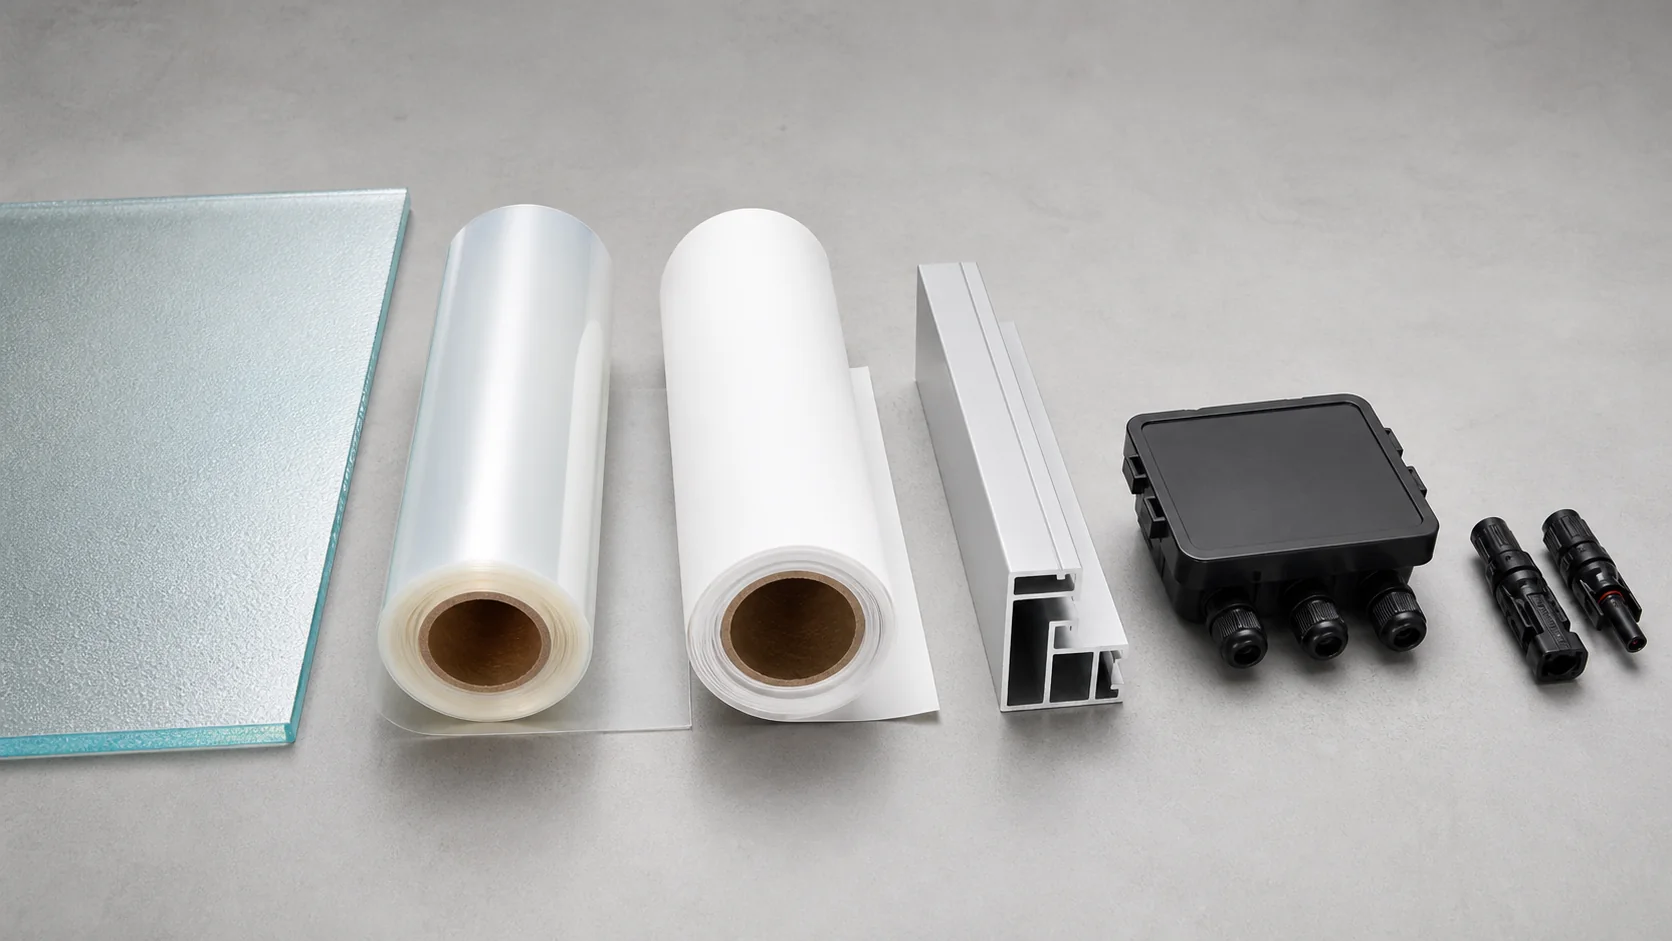
| Component | Job | Investor question |
|---|---|---|
| Solar glass | Light transmission and weather protection | Furnace utilisation, fuel cost and import-price pressure? |
| Encapsulant / backsheet | Adhesion and electrical insulation | Customer qualification and field-failure data? |
| Aluminium frame | Mechanical strength | Metal pass-through and extrusion efficiency? |
| Junction box / connector | Safe current transfer | Certification, traceability and recall risk? |
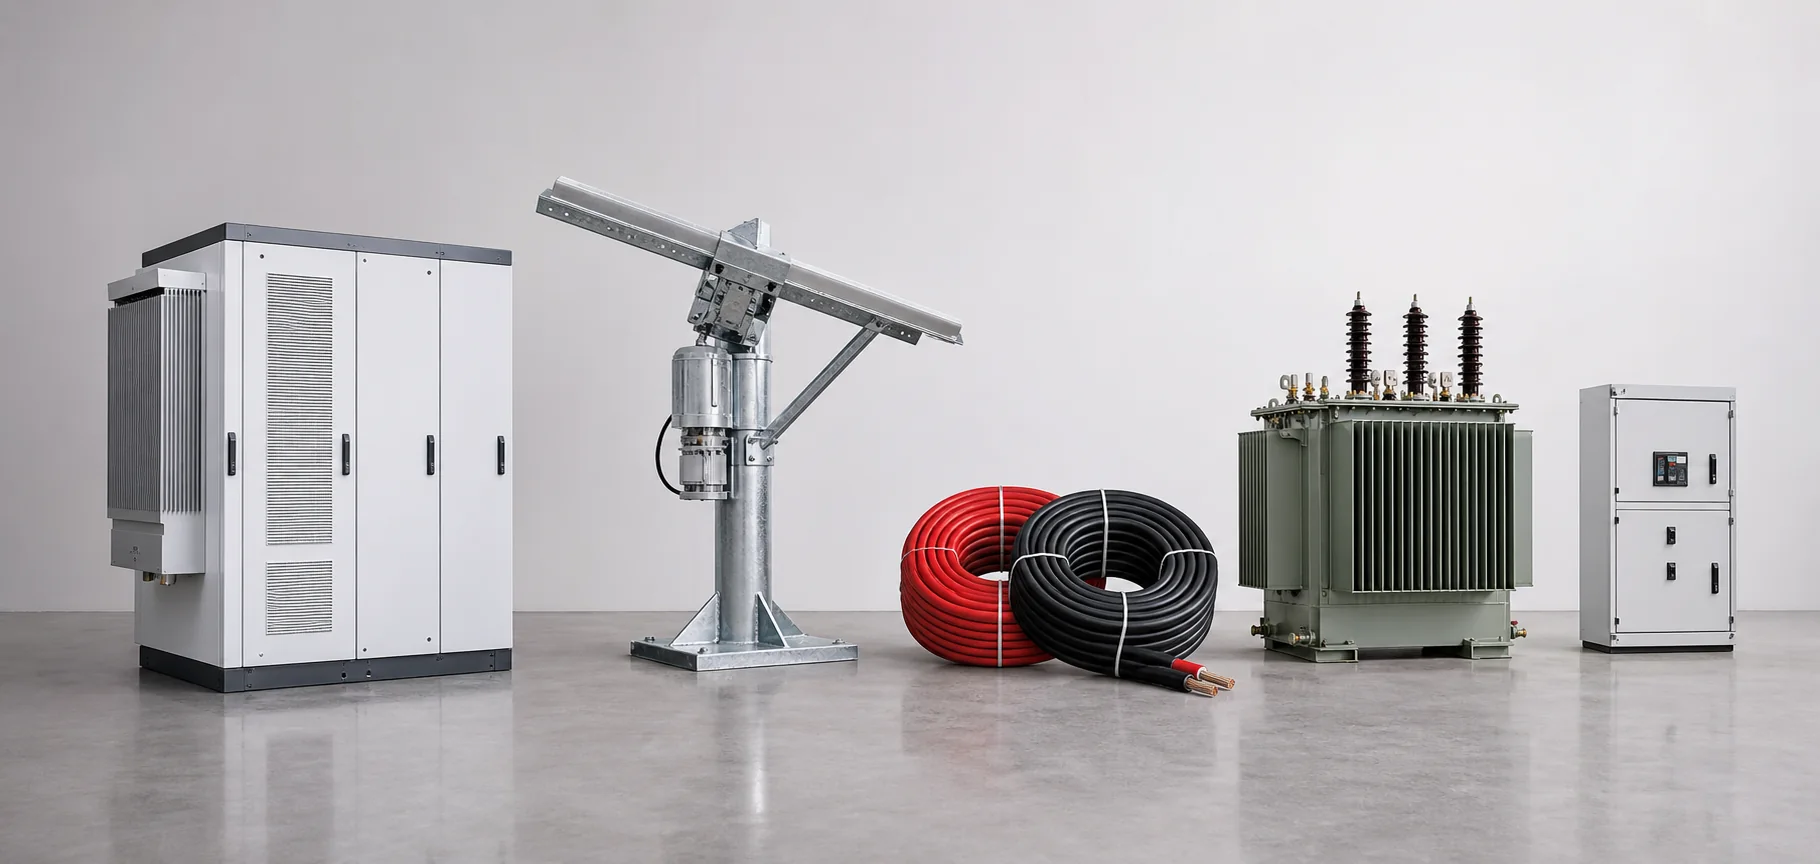
Inverters convert, cables carry, transformers change voltage, switchgear protects and the transmission grid moves power to customers.
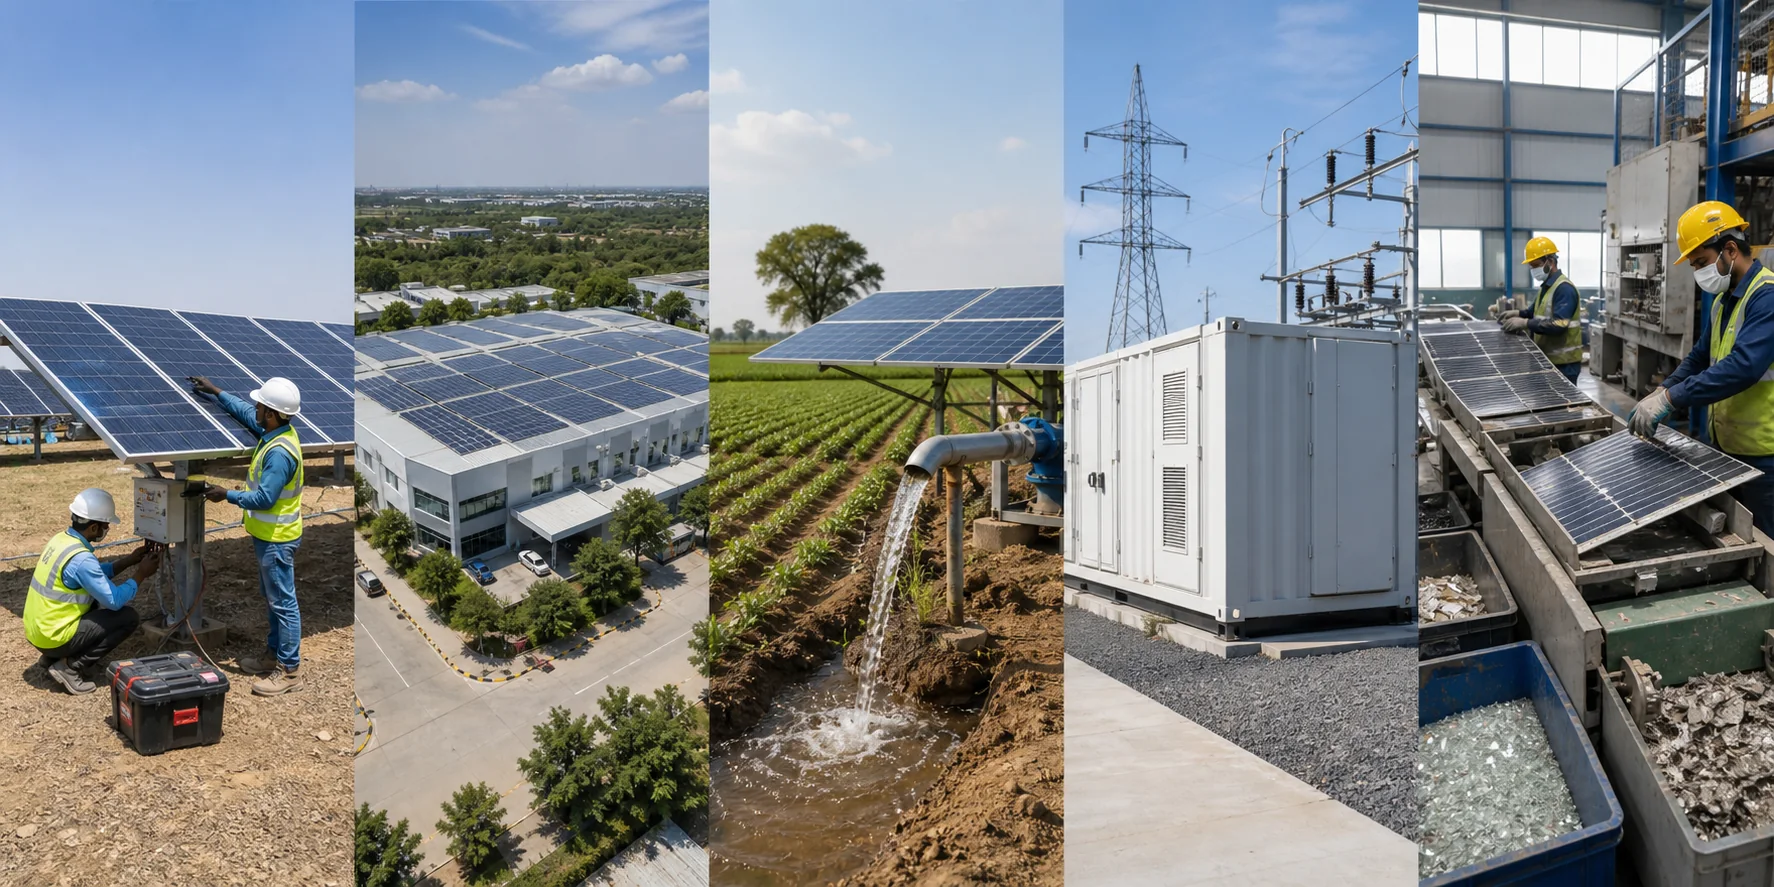
Project delivery, finance, service and contract design decide who earns money and who only reports an order book.
| Business | How it earns | Hidden risk | Best analysis lens |
|---|---|---|---|
| Manufacturer | Product sale and sometimes service/warranty | Price cycle, technology, utilisation | Mid-cycle margin + incremental ROCE |
| EPC / O&M | Construction milestones + service fee | Delay, cost overrun, collection | Backlog-to-cash conversion |
| Rooftop / C&I | Sale, lease or energy service | Customer credit and roof quality | Unit economics + retention |
| IPP / utility | Long-term PPA or regulated tariff | Debt, curtailment, counterparty | Asset DCF + DSCR |
| Solar pumps | Equipment, installation and service | Tender receivables and subsidy timing | Cash cycle + state mix |
| Storage | Availability, capacity or energy-spread contract | Degradation, penalties, augmentation | Contract-specific cash flow |
The important product is dispatchable renewable power: solar + wind + storage + grid connection + enforceable contract.
Solar, wind and storage combined for assured peak or demand-following supply.
COMMERCIALISINGTransmission, digital substations, transformers, cables and forecasting become bottlenecks.
RESEARCH FIRSTPolicy and capex move upstream from simple module assembly.
EXECUTION MATTERSTOPCon and newer architectures raise output but shorten technology cycles.
TECH RISKCustomer acquisition, credit, monitoring and service can become the moat.
DISTRIBUTION PLAYOld sites replace modules and inverters to lift output from the same land/grid.
EMERGINGCollection and material recovery grow as equipment reaches end-of-life.
EARLY-STAGELow-cost renewable power can feed electrolysers and industrial demand.
OPTIONALITY / HIGH RISKA scheme name is not enough. Eligibility, product list, effective date, transition window and actual cash receipt matter.
| Programme / rule | What changes | Investor diligence |
|---|---|---|
| ALMM List-I / List-II | Approved module and cell eligibility for specified demand | Live list, effective date, product scope, exceptions |
| Domestic content | Domestic cells/modules for defined projects | Project category and procurement condition |
| Manufacturing PLI | Performance-linked support for selected capacity | Commissioning, sales, audit and actual receipt |
| PM Surya Ghar | Residential rooftop demand and consumer support | Vendor quality, finance, installation, service |
| PM-KUSUM | Agricultural pumps and decentralised solar | State execution, subsidy flow, service network |
| Storage / FDRE tenders | Flexible and assured renewable supply | Tariff, availability, degradation, penalties |
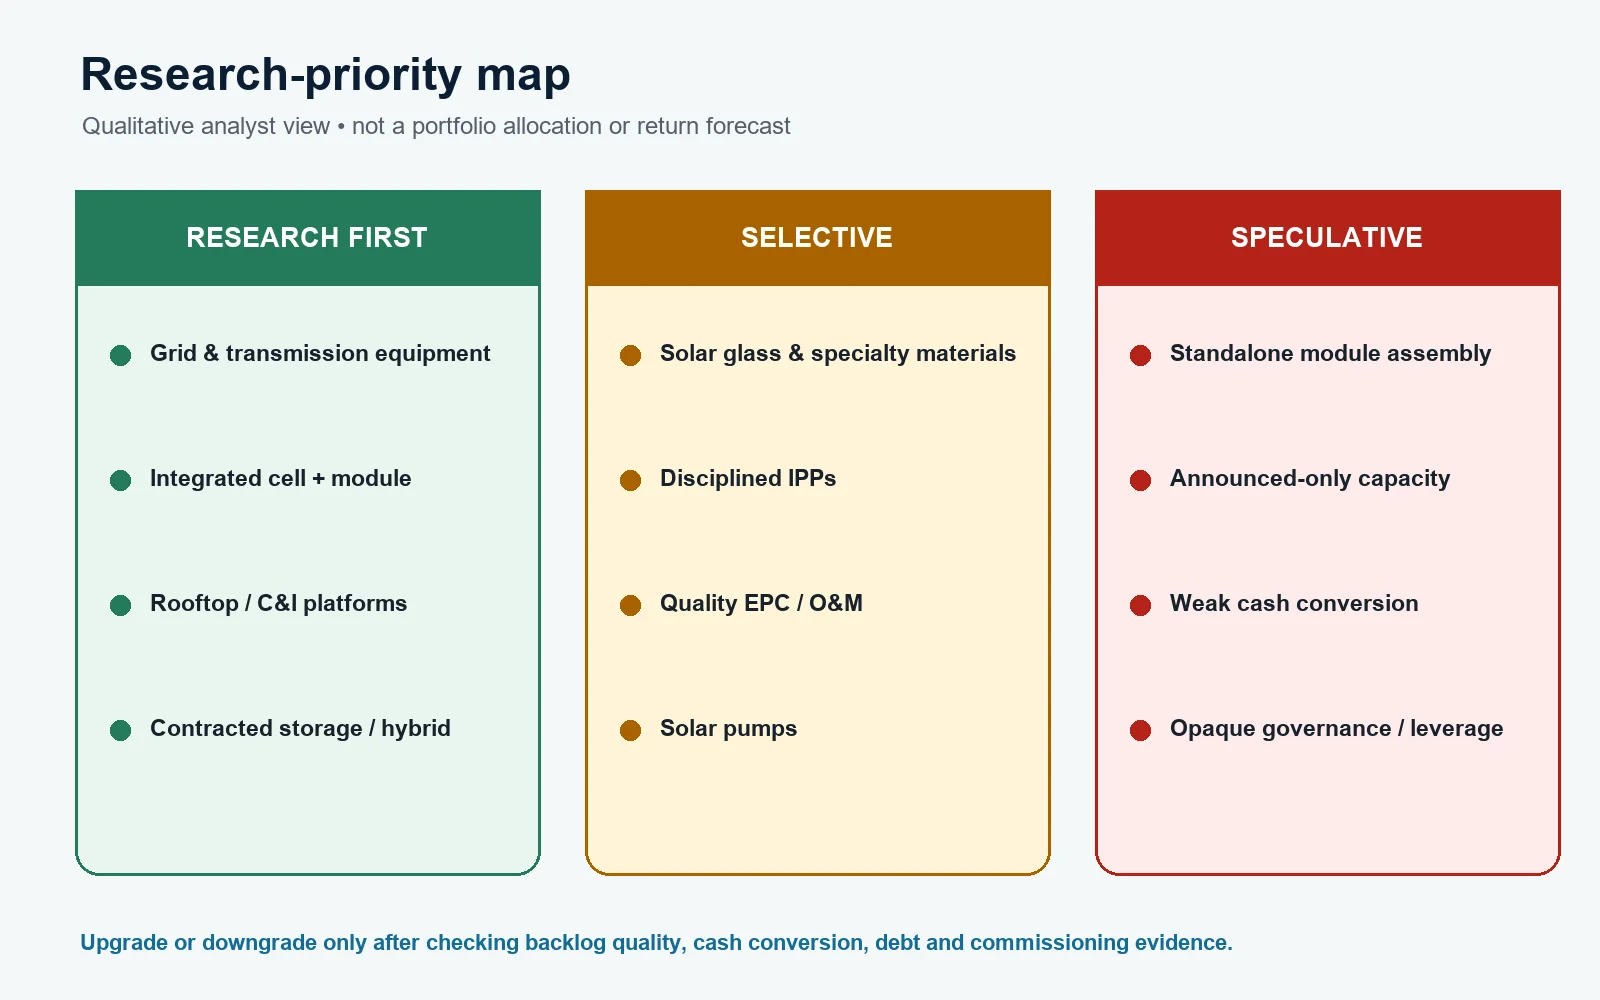
This is a qualitative research order—not a portfolio allocation, action label or target return.
Announced, installed, qualified or cash-generative?
Capacity × utilisation × yield × mix.
Not list price or an industry headline.
Inputs, power, warranty, service and incentive.
Inventory, receivables, advances and retention.
Price fall, delay, tech change, debt and policy.
Announced machines create no cash.
Qualified output, utilisation, sales and collection create value.
Cheaper modules improve demand.
They may destroy manufacturer margin and inventory value.
Orders look like future revenue.
Customer credit, cancellation, margin and WC decide quality.
Storage demand is rising.
Contract, degradation, augmentation and finance decide return.
Support can create demand.
Eligibility, timing and transition windows add risk.
Reported margin looks attractive.
Receivables, inventory, capex and interest can consume it.
Realised price falls faster than input cost.
Efficiency gap widens; new capex is required.
Advances rise without commissioning proof.
Receivables grow faster than revenue.
Short-term debt funds long-lived assets.
Cash tracks profit and customers repeat.
A factual number must match definition, date and unit across separate official publications. Installed capacity is never compared with an announcement pipeline.
Each company begins with a plain-language business introduction, then moves into evidence, 14-pattern scoring, valuation, risks, financial screenshots and price-history context.
Every available annual report and complete call transcript was read. Capacity, order book and guidance are treated as promises until delivery appears in numbers and cash.
P1–P8: working capital, acquisition, exit, demerger, niche, share gain, capacity trigger and management reset.
P10–P12: talk-vs-numbers, cross-quarter consistency and promise delivery.
P13 rewards only known combinations. P14 tests direct sector fit.
P9 penalises governance, dilution, leverage, litigation, receivables and execution clusters. Two severe flags cap score at 30.
Use the filter to compare a value-chain segment. Exact half-points decide rank; the large display score is rounded.
| Rank | Company | Role | Original /50 | Management /35 | P13 | P14 | P9 | Exact score | Band |
|---|
This is a pattern rank, not an expected-return rank. Valuation and personal suitability are deliberately kept outside the score.
GE Vernova and Polycab have strong operating evidence but demanding dated multiples. Execution must keep beating expectations.
JSW, Waaree, Premier, ACME and Vikram need commissioning, cash conversion and leverage discipline.
Grid, glass and EPC names can rerate if promised projects convert, but the evidence is not yet complete.
Low trailing P/E cannot neutralise receivable, pledge, governance or balance-sheet evidence. Cheap-looking and low-risk are different ideas.
P/E values below come from supplied Screener snapshots or the prior grid report, dated 6 August 2026. Provider methodology and exceptional items can distort trailing multiples.
A low multiple may reflect peak-cycle margins, cash-flow stress or a disputed balance-sheet item.
At a high multiple, even good execution may already be expected. Small misses can matter more.
Project-financed generators cannot be compared one-for-one with debt-light manufacturers using only debt/equity.
Material audit matters, leverage, dilution, pledges, receivables and legal exposures were kept visible. Severity is framework scoring, not a finding of wrongdoing.
Signed or audited document, separate official disclosure, then arithmetic and unit reconciliation.
129 unique PDFs and 15,520 pages passed the merged-corpus integrity check.
No price-history inference for Insolation without a saved TradingView chart.
Local annual reports and complete concall transcripts form the evidence base. Links below are the current official hubs or exact filings used for cross-checking.